
Analytics
See the architecture drift before it becomes a rewrite
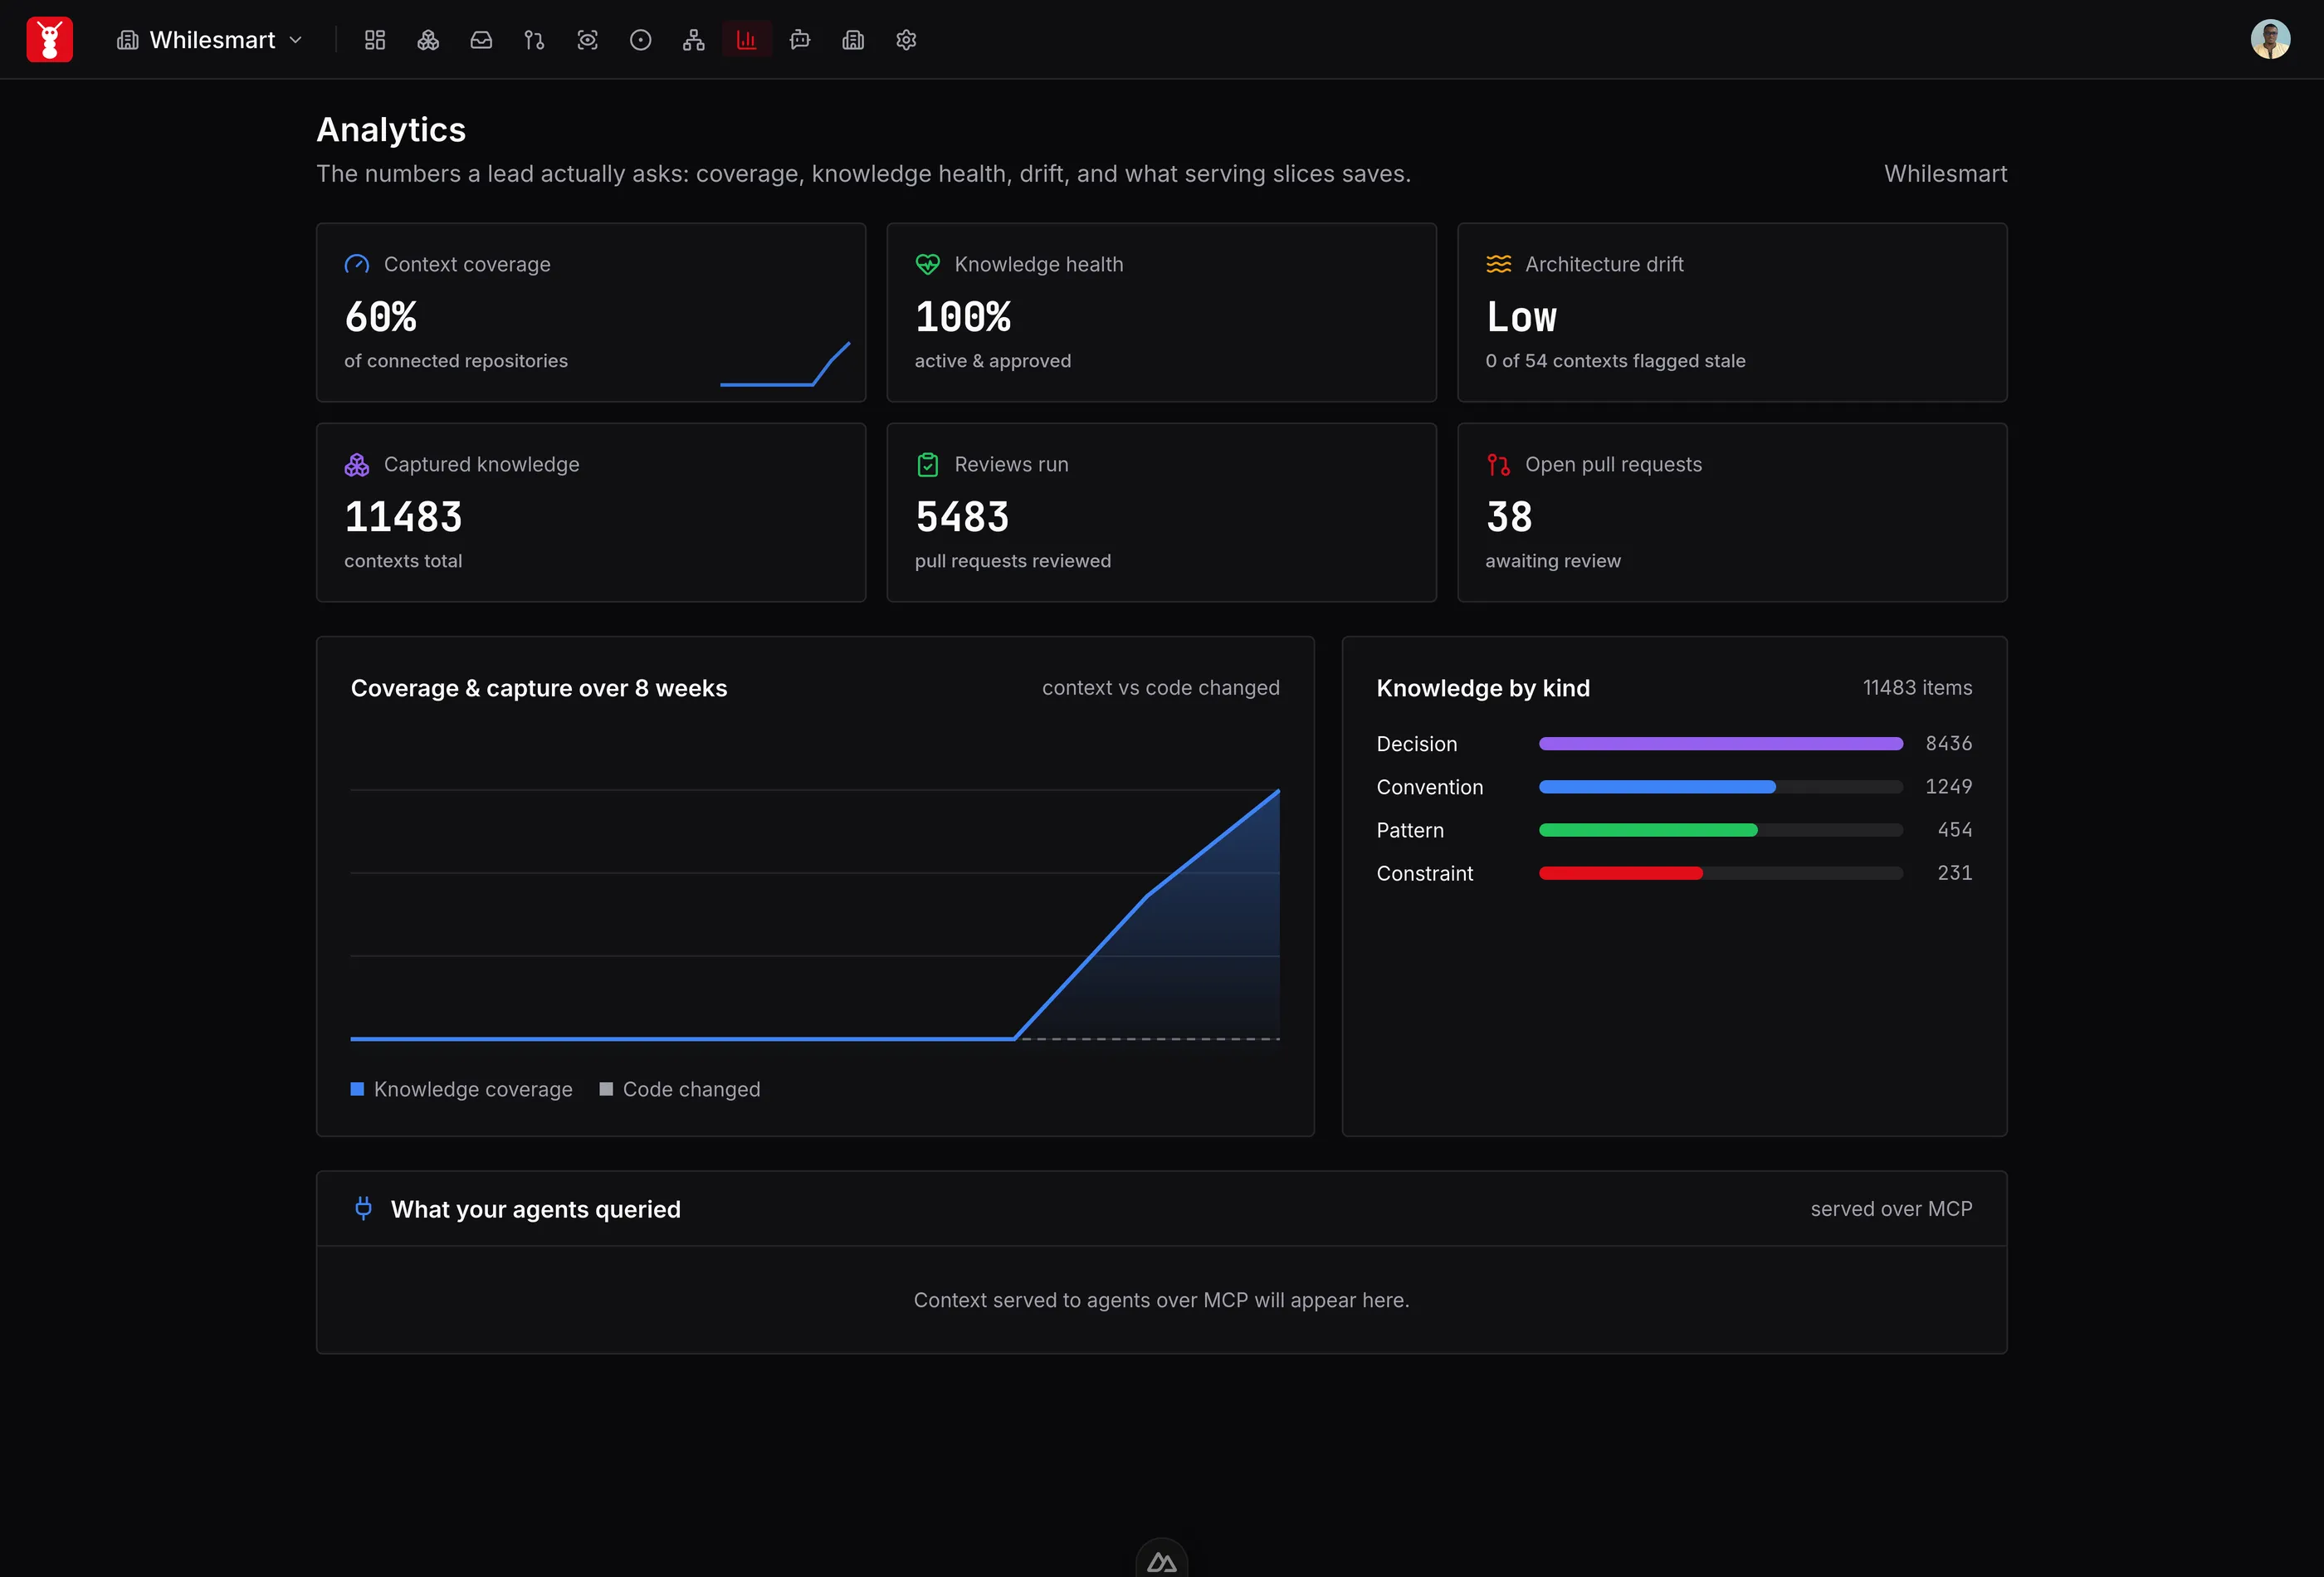
Coverage and capture tracked against code churn week by week, so you can see whether understanding is keeping up with change.
Self-host free · Bring your own tools
Sound familiar?
More activity does not mean more understanding.
As code changes, yesterday’s knowledge can cover less of today’s system. Follow coverage and capture over time to see where the gap is growing.
How it works
From the first signal to the next action.
- 01
Follow coverage
See how much of the code has context and how capture changes alongside code churn.
- 02
Watch review quality
Read review and triage analytics alongside the knowledge the applications draw on.
- 03
Understand usage
Track token usage and savings so you can see what your analysis consumes.
Built around your work
Give the next improvement a starting point.
Use the coverage and usage trends to decide where to capture more context and where to examine the cost of analysis.
Before you get started.
Where are analytics available?
Analytics are part of the SourceAnt Cloud workspace, alongside knowledge management, the graph and applications.
What can I track?
Context coverage and capture, token savings, review quality and triage are included in the hosted analytics.